The agricultural sector is undergoing a profound transformation, driven by the integration of smart technologies. At the forefront of this revolution in livestock management, particularly in pig farming, is Trackfarm, a solution that turns complex farm data into actionable, visual intelligence. The days of relying solely on intuition and manual checks are fading, replaced by a data-driven approach where the farm’s entire ecosystem is monitored, analyzed, and optimized through a single, intuitive dashboard.
The Data Deluge: A Challenge and an Opportunity
Modern pig farming generates an enormous volume of data. From environmental factors like temperature, humidity, and air quality to individual animal metrics such as feeding patterns, weight gain, and health status, the sheer quantity of information can be overwhelming. The challenge for farmers is not in collecting the data, but in making sense of it quickly enough to intervene effectively. A delay of even a few hours in identifying a health issue or a ventilation problem can translate into significant financial losses and animal welfare concerns.
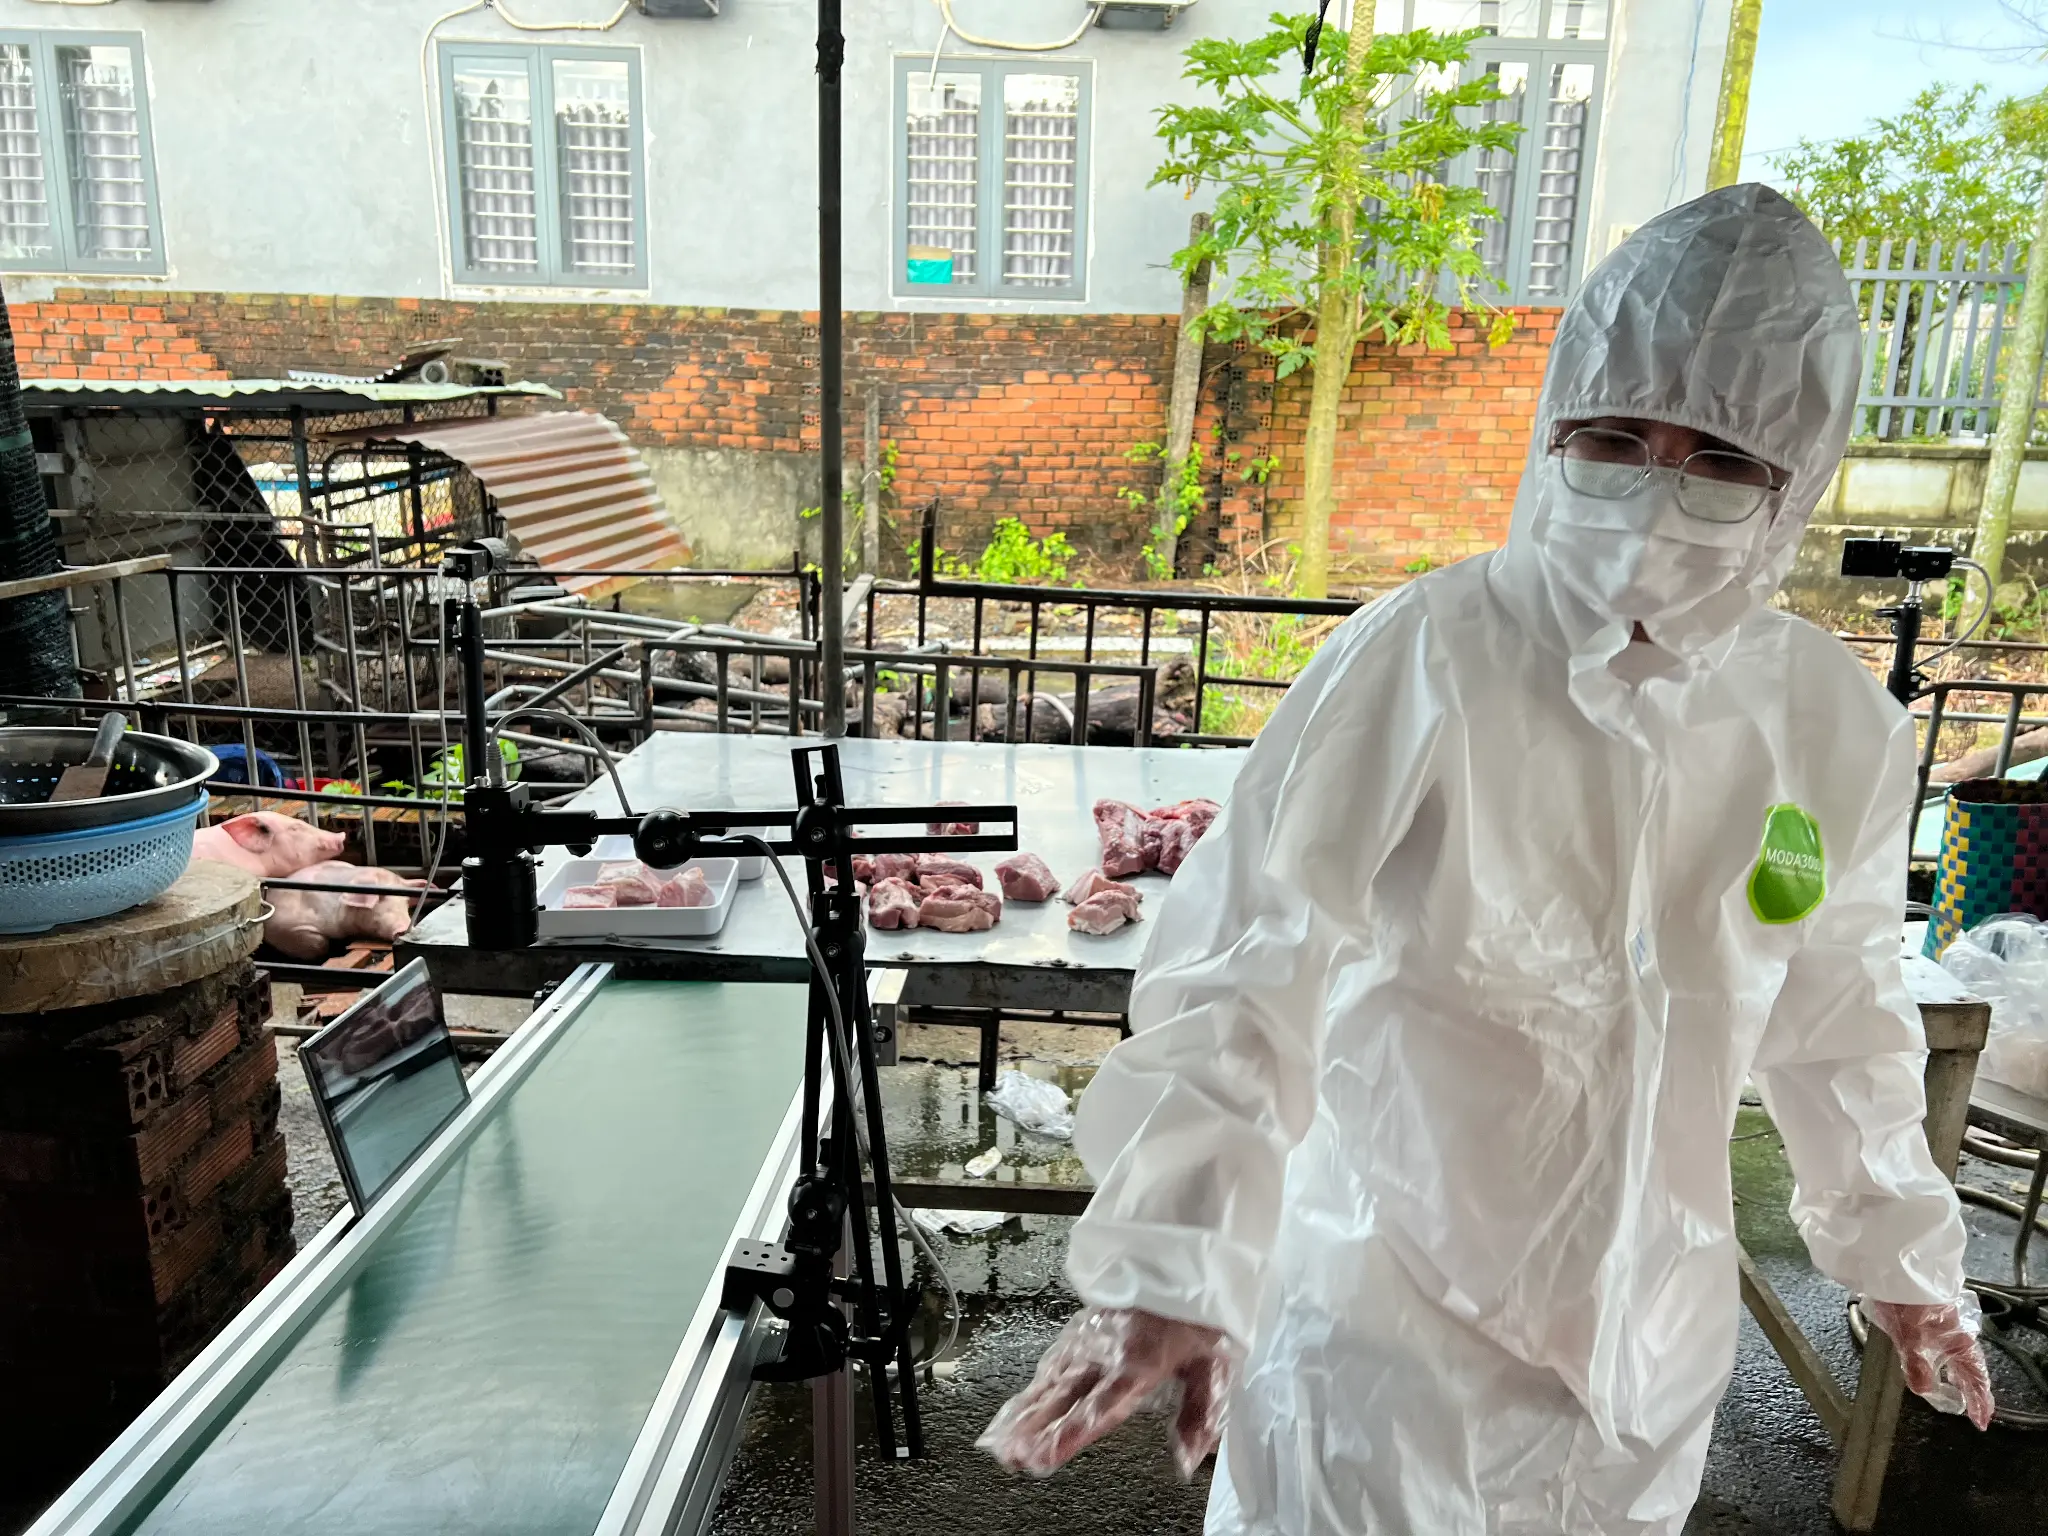
Trackfarm addresses this challenge head-on. Its system collects data from a network of sensors, cameras, and feeding equipment, funnels it through advanced analytics, and presents the results in a series of dynamic, easy-to-read dashboards. This visualization is the key to empowerment, transforming raw numbers into a clear narrative of the farm’s performance.
The Anatomy of an Empowering Dashboard
Trackfarm’s dashboards are not one-size-fits-all; they are meticulously designed to cater to different operational needs, providing both a high-level overview and the ability to drill down into granular detail.
1. The Health and Welfare Dashboard
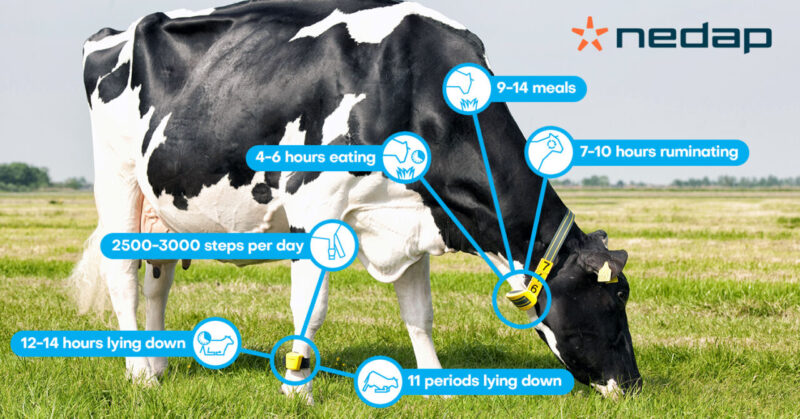
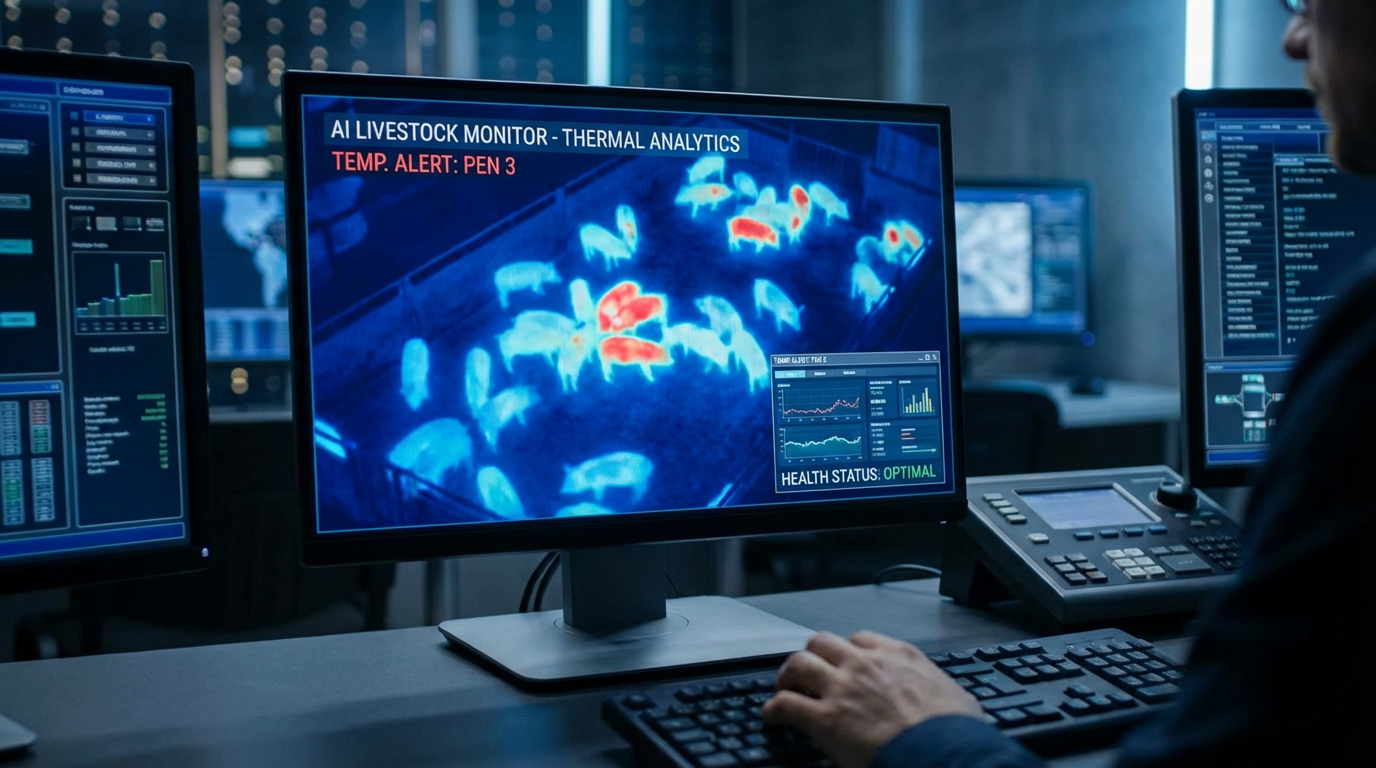
This is arguably the most critical component. It moves beyond simple mortality rates to provide predictive health analytics. By monitoring subtle changes in behavior—such as reduced activity, altered feeding times, or unusual vocalizations detected by acoustic sensors—the system can flag potential issues before clinical symptoms even appear.
The dashboard displays a “Health Score” for each pen or group, calculated from a composite of environmental and behavioral data. A sudden drop in this score triggers an immediate alert, allowing farm staff to isolate the affected animals and begin treatment promptly. This proactive approach significantly reduces the spread of disease and minimizes the need for broad-spectrum antibiotics.
2. The Environmental Control Center
Optimal environmental conditions are paramount for pig growth and feed conversion efficiency. The Environmental Control Center dashboard provides real-time graphs of key parameters:
- Temperature and Humidity: Visualized against ideal ranges for the current growth stage.
- Ammonia and CO2 Levels: Critical indicators of air quality and ventilation effectiveness.
- Ventilation Status: Real-time feedback on fan speed, damper positions, and energy consumption.
Farmers can see historical trends and make immediate adjustments to the automated climate control systems directly from the dashboard, ensuring a consistently comfortable and healthy environment for the livestock.
3. The Feed and Growth Performance Dashboard
Feed costs represent the largest operational expense in pig farming. Optimizing feed conversion ratio (FCR) is essential for profitability. This dashboard provides a comprehensive view of nutritional efficiency:
- Daily Feed Intake (DFI): Tracked per pen and compared against target benchmarks.
- Average Daily Gain (ADG): Calculated automatically using weight estimates from 3D cameras or smart scales.
- FCR Analysis: A real-time calculation showing the efficiency of feed usage.
The visualization allows farmers to identify pens with underperforming FCRs, prompting an investigation into potential causes, whether it be feed quality, health issues, or environmental stress.
From Data Points to Strategic Decisions
The true power of Trackfarm’s dashboards lies in their ability to facilitate strategic decision-making, moving beyond day-to-day management to long-term planning.
Benchmarking and Comparative Analysis
The system allows farmers to compare the performance of different batches, pens, or even different barns over time. This comparative analysis is presented through side-by-side charts and heatmaps, making it easy to spot best practices and areas for improvement. For instance, a farmer might discover that a specific feed formulation performs significantly better in a barn with a particular ventilation setup.
| Performance Metric | Batch A (Trackfarm Optimized) | Batch B (Traditional Management) | Improvement |
|---|---|---|---|
| Average Daily Gain (ADG) | 0.95 kg/day | 0.88 kg/day | +8.0% |
| Feed Conversion Ratio (FCR) | 2.5:1 | 2.8:1 | +10.7% |
| Mortality Rate | 1.5% | 3.2% | -53.1% |
| Time to Market | 165 days | 178 days | -13 days |
This kind of clear, quantifiable data empowers the farmer to make evidence-based decisions on everything from genetics and nutrition to infrastructure investment.
Predictive Modeling for Inventory and Sales
By analyzing growth curves and historical data, Trackfarm can accurately predict when a batch of pigs will reach target market weight. This predictive capability is invaluable for inventory management and coordinating with processors, ensuring optimal timing for sales and reducing holding costs. The dashboard provides a rolling forecast, updating daily based on the latest growth data.
The User Experience: Simplicity in Complexity
One of the most significant barriers to technology adoption in agriculture is complexity. Trackfarm has prioritized a clean, intuitive user interface. The dashboards are designed with a “three-click rule”: any critical piece of information should be accessible within three clicks from the main screen.
The use of color-coding, clear icons, and graphical representations—rather than dense tables of numbers—ensures that even during a busy day, a farmer can quickly interpret the status of their operation. Red, yellow, and green indicators immediately draw attention to areas requiring intervention, allowing for management by exception.
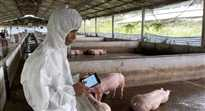
Furthermore, the system is fully mobile-optimized. Farmers can access the complete suite of dashboards on a smartphone or tablet, allowing them to monitor and control their farm operations whether they are in the barn, at home, or on the road. This mobility is crucial for the modern farmer who is constantly on the move.
Case Study: Revolutionizing a 5,000-Head Operation
Consider the example of a large-scale pig farm in the Midwest that adopted Trackfarm. Before implementation, the farm struggled with inconsistent FCRs and periodic, unexpected disease outbreaks that required costly mass treatments.
Within six months of using the Trackfarm dashboards, the farm saw a dramatic shift:
- Early Detection: The health dashboard identified a respiratory issue in a single pen 72 hours before the farm manager would have noticed it manually. Quick isolation prevented the spread to adjacent pens.
- FCR Improvement: By using the feed dashboard to fine-tune the feeding schedule and environment, the farm improved its average FCR by 0.2 points, translating to a substantial saving in feed costs over the year.
- Labor Efficiency: The ability to monitor all environmental controls remotely and receive targeted alerts reduced the time spent on routine checks by over 15 hours per week, allowing staff to focus on animal care.
The farm manager noted, “It’s not just about the data; it’s about the confidence the dashboard gives us. We know, in real-time, that our animals are comfortable and our operation is running at peak efficiency. It’s like having a team of data scientists working for us 24/7.”
The Future is Visual: Expanding the Dashboard’s Reach
Trackfarm is continually evolving its dashboard capabilities. Future developments are focused on integrating even more sophisticated AI models to provide deeper insights:
- Individualized Nutrition: Using computer vision to estimate the weight and body condition of individual pigs and automatically adjusting their feed dispenser for personalized nutrition.
- Stress Monitoring: Analyzing patterns of movement and grouping to quantify stress levels and correlate them with environmental changes or social dynamics.
- Sustainability Metrics: Adding dashboards to track and report on water usage, manure management, and carbon footprint, helping farms meet growing regulatory and consumer demands for sustainable agriculture.
The goal remains the same: to provide the farmer with a complete, visual command center that simplifies the complex task of modern livestock management.
Conclusion: Empowering the Next Generation of Farmers
Trackfarm’s success is a testament to the power of visualization in the age of big data. By consolidating disparate information into clear, actionable dashboards, the solution empowers farmers to move from reactive problem-solving to proactive optimization. It reduces risk, improves animal welfare, and drives profitability, ensuring that smart pig farming is not just a technological possibility, but a commercial reality.
The dashboard is more than just a screen full of charts; it is the farmer’s new lens on their operation, offering clarity, control, and the visual confirmation of success. For the future of sustainable and efficient livestock production, seeing is truly believing, and Trackfarm is providing the vision.
About Trackfarm: Trackfarm is a leading provider of smart livestock solutions, specializing in advanced data analytics and visualization tools for pig farming. Their mission is to enhance farm efficiency, animal welfare, and sustainability through cutting-edge technology.